Home Build end-to-end solutions with Fabric Real-Time Intelligence
Ingestion, transformation, storage, analysis, visualisation, tracking and artificial intelligence working in the same real-time environment is what Real-time data analytics enables. This means that data remains protected, governed and integrated into the business, aligned in the same data integration platform.
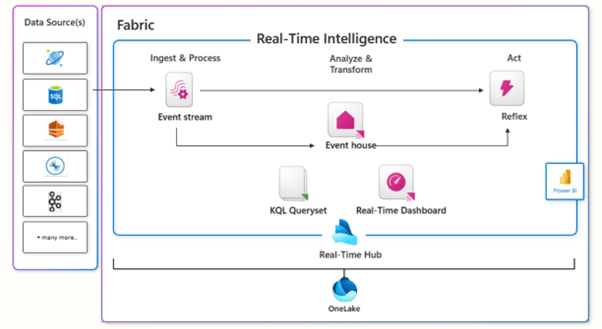
To develop a real-time big data analytics project, every step of the project will be carried out in order to achieve the expected result. The stages will include the following:
Working with data collection is the first step to start with.
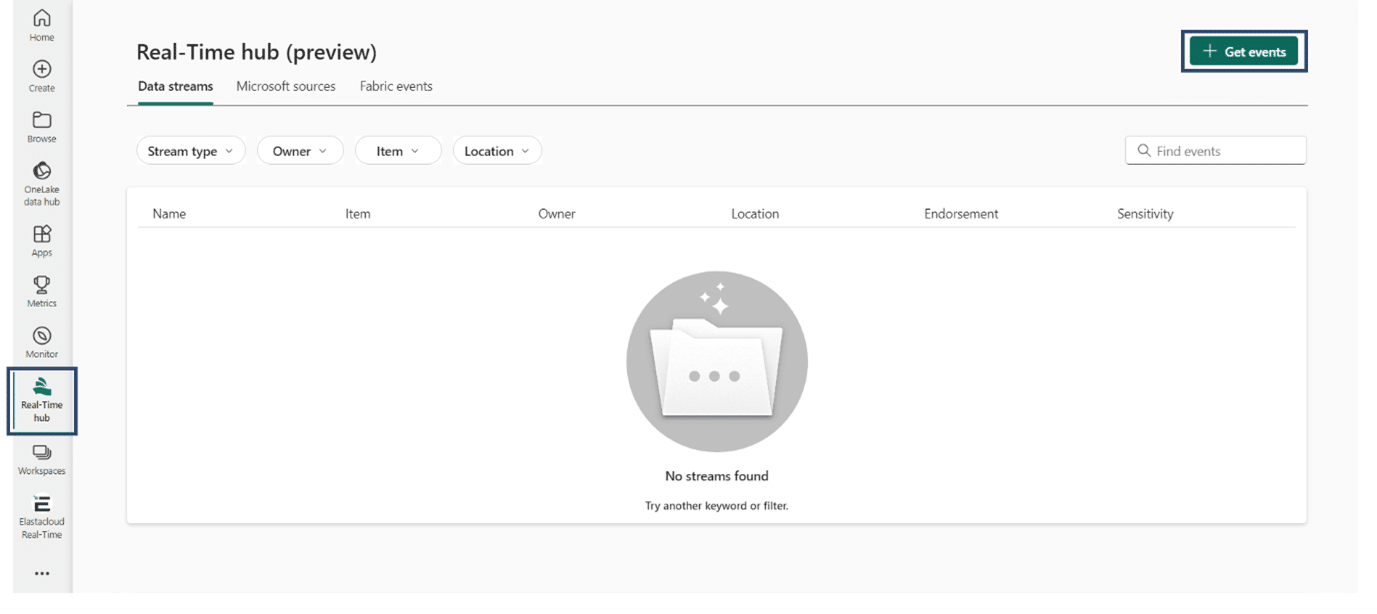
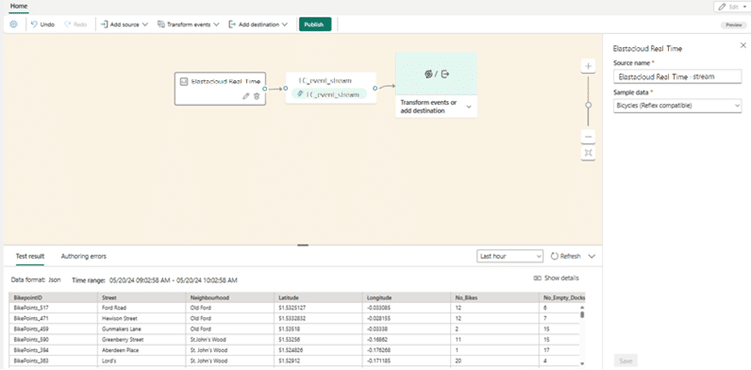
This workshop is based on sample streaming data called Bicycles.
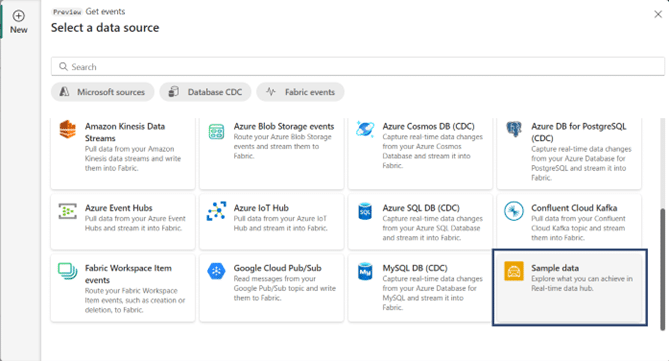
This sample is a bicycle data set with a preset outline column such as street, neighbourhood, number of bikes, location and more. This sample data allows the real-time number of bike events to be simulated and analysed with various destinations, such as the KQL database.

Once published, select Add Destination to work with the KQL Database. To continue with the configuration, the KQL database data must be configured.

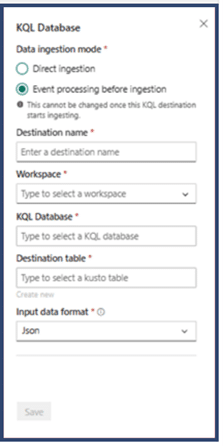
When the process is concluded, the data will be ready to be added to the transformations.
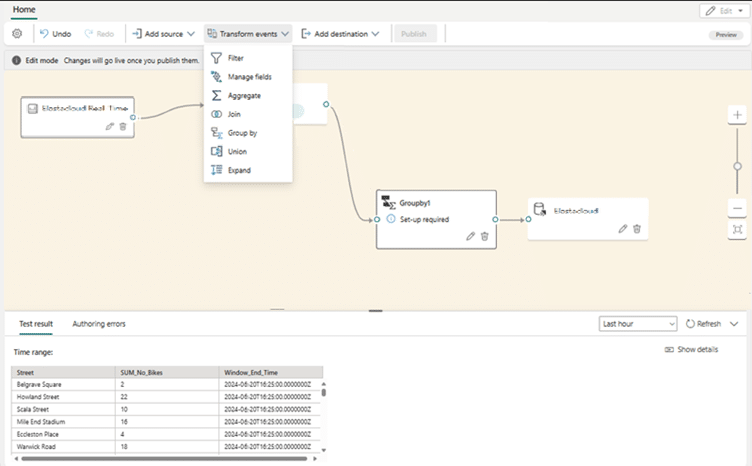
From the Eventstream canvas, transformations can also be performed to prepare the data according to the requirements.
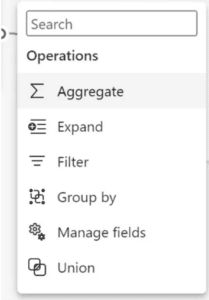
As an example, grouping on the bike data will be the transformation to be worked on.
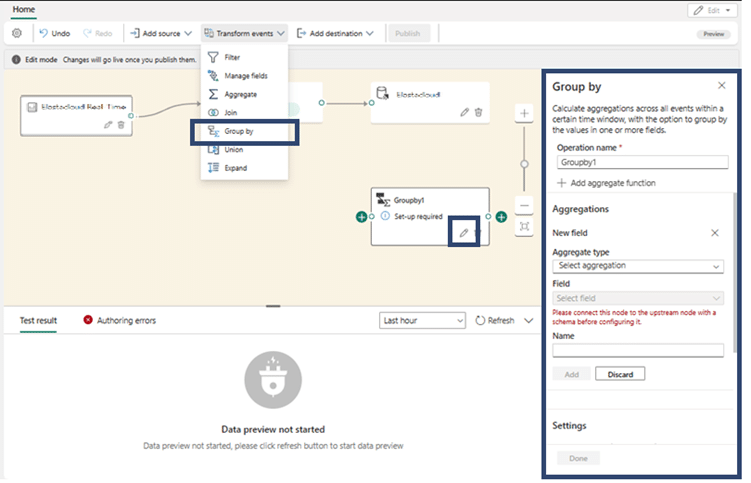
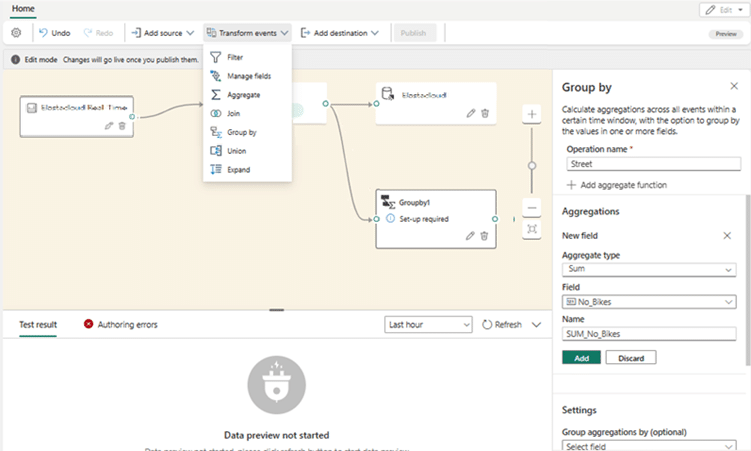
After creating the Group by transformation event, in this case, the eventstream will need to be connected to the Group by event.
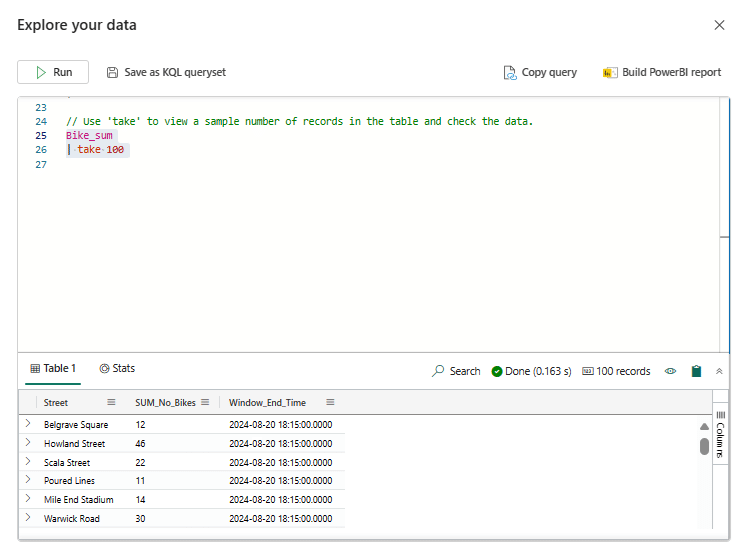
Kusto Query Language (KQL) is designed as a read-only query to process data and return results. It is requested in plain text, using a dataflow model that is easy to read, create and automate. All queries are executed always in the context of a concrete table or database. As a minimum, a query contains a reference to the original data and one or more query operators applied in sequence, which is indicated visually by the use of a pipe character.
This first query uses the take operator to return a sample number of records, and is useful to get a first look at the data structure and possible values.
Return to the data tree to select the next query, which uses summarize operator to count the number of records ingested in 15-minute intervals.

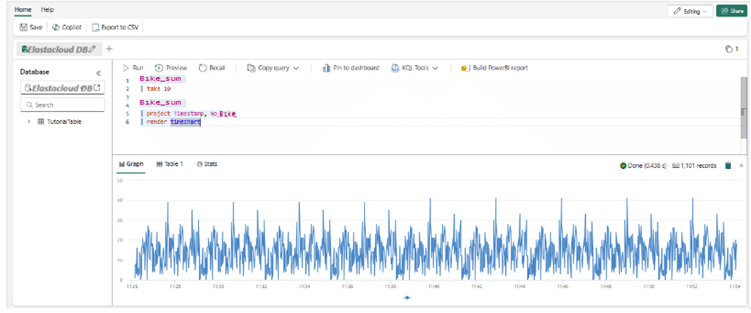
Another way to get results from queries is to visualise the data by using the render operator.
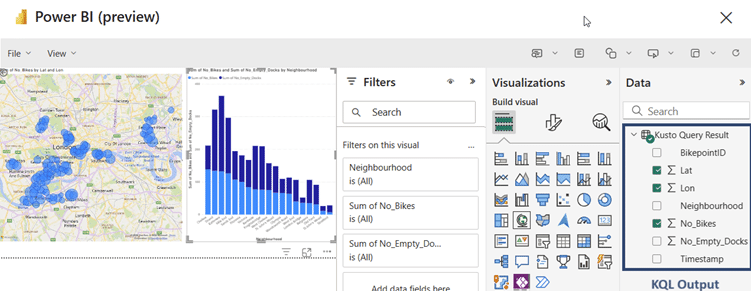
Power BI reports are multi-perspective insights into a semantic model, with visuals that display findings and insights from that model. KQL output will be created to build a new Power BI report, working with summarize operator.
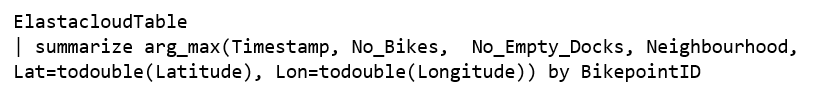
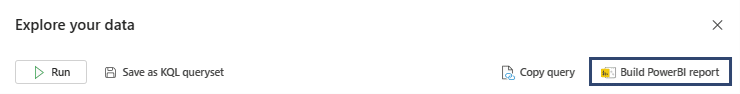
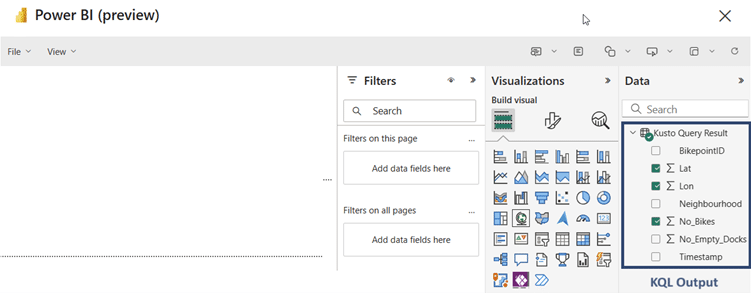
Select Build Power BI report. The Power BI report editor opens with the query result available as a data source named Kusto Query Result.
Once Power BI displays the table that has been created from the data developed in KQL using the summarise operator, visualisations can be created.
In this way, the visualisations that will be required on the data that is displayed can be developed from within Power BI.